Yesterday I spent an hour trying to figure out what SurveyMonkey’s “A/B testing calculator for statistical significance” does (please don’t use it). This calculator claims it can be used to test for a statistically significant difference in some proportion measured across two groups, as you might want to do when analysing survey results.
The explanation under the calculator says it does a two-proportion z-test, which is a reasonable statistical test for this case, but I get very different p-values than the calculator produces if I do the same test in R (with the prop.test() function).
The worked example given on the calculator page compares two groups both of size 50,000, with 500 successes (1%) in the first group and 570 (1.14%) in the second group. In explanation of this example it says “z-score is 14%”. That’s not correct. The number of successes in the second group is 14% bigger than in the first group, but that is not the z-score for a z-test. The correct z-score for this example is 2.15.
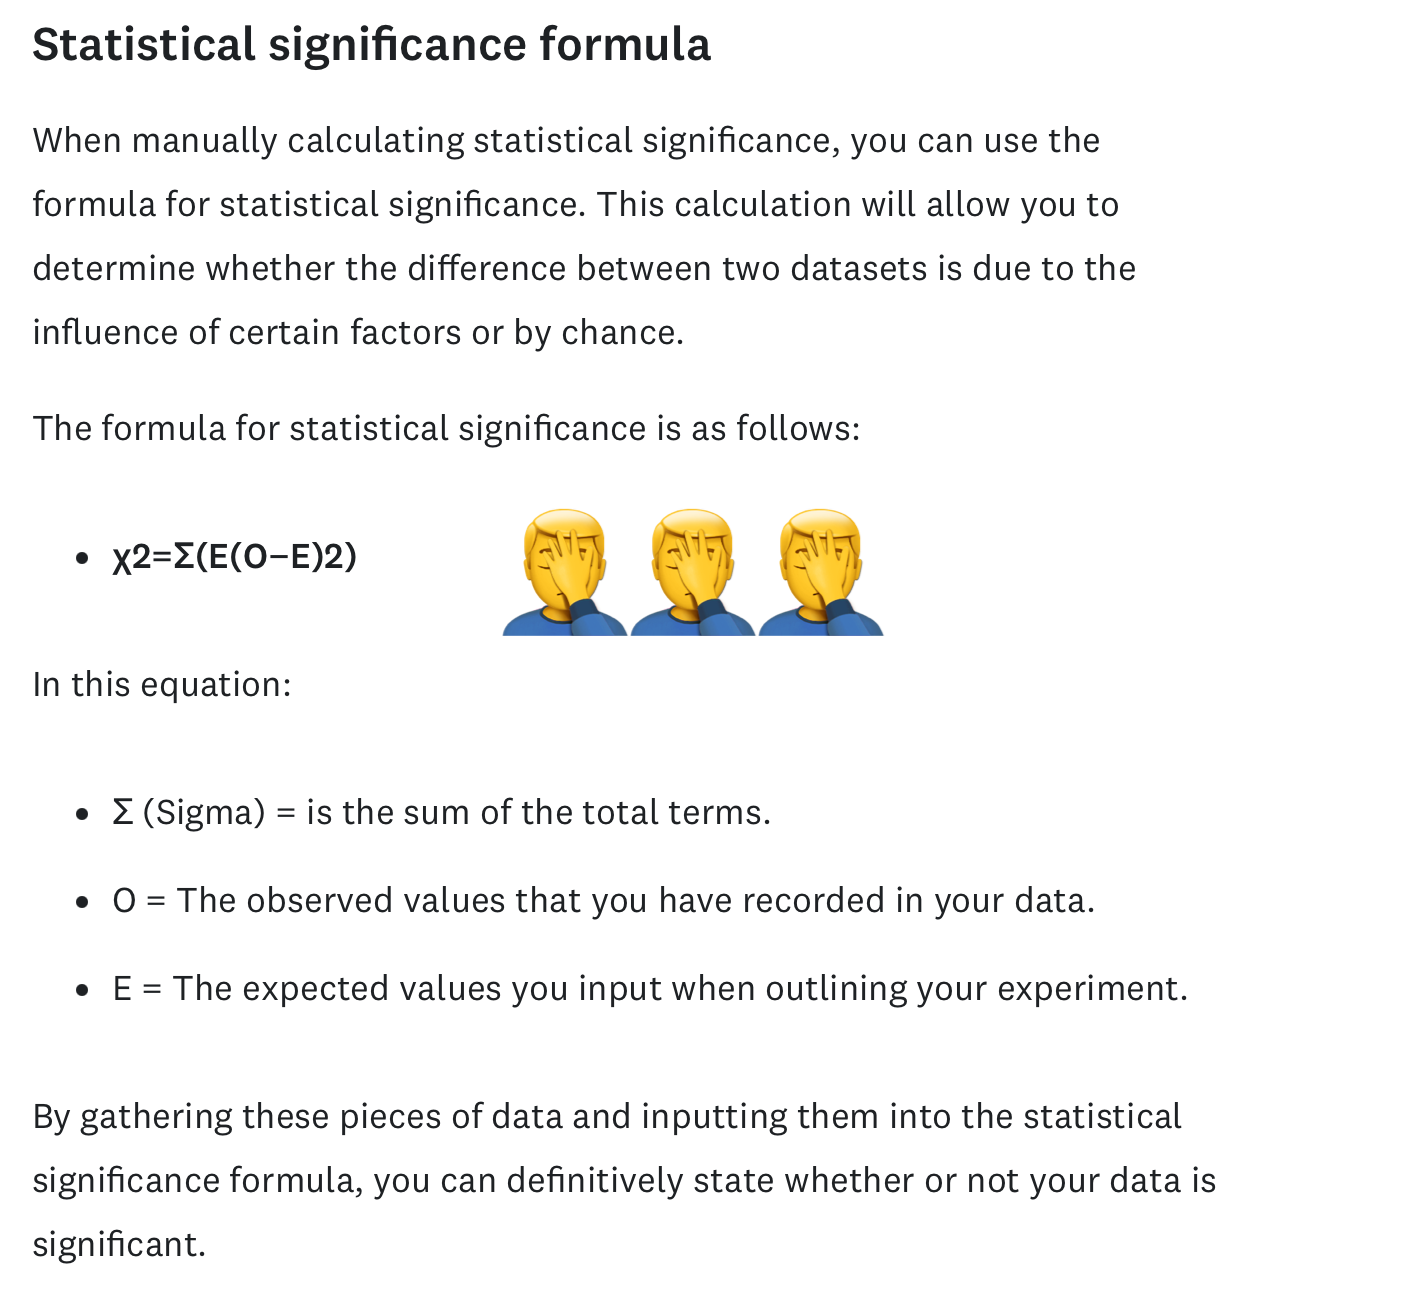
A further clue comes from clicking on one of the links to another page titled “understanding statistical significance”. Please see the screenshot below from that page (emojis added by me). The formula given is an incorrect expression for a Chi-squared statistic and is definitely not a “formula for statistical significance” that can be used to “definitively state whether or not your data is significant”.

My guess is this is semi-nonsense output from Generative AI. If so it must be a fairly primitive AI as ChatGPT-4o gets this stuff correct, and when I asked ChatGPT about SurveyMonkey’s calculator in my attempt to understand what was happening, ChatGPT was just as confused as I was.
This is really disappointing because SurveyMonkey is used and trusted by many people to run surveys and it should do this basic stuff better.
After comparing with several other online A/B testing calculators, I believe that SurveyMonkey’s calculator actually does a Bayesian comparison of the proportions. That’s fine in principle, but it’s a completely different approach to the classical hypothesis test that is described on the calculator page and has a different interpretation. What they call the “p-value” is actually the probability that the group with the lower of the two proportions has a higher proportion than the other group (I think; I still don’t really understand what they are doing).
In summary, the whole thing is a mess and shouldn’t be trusted.
