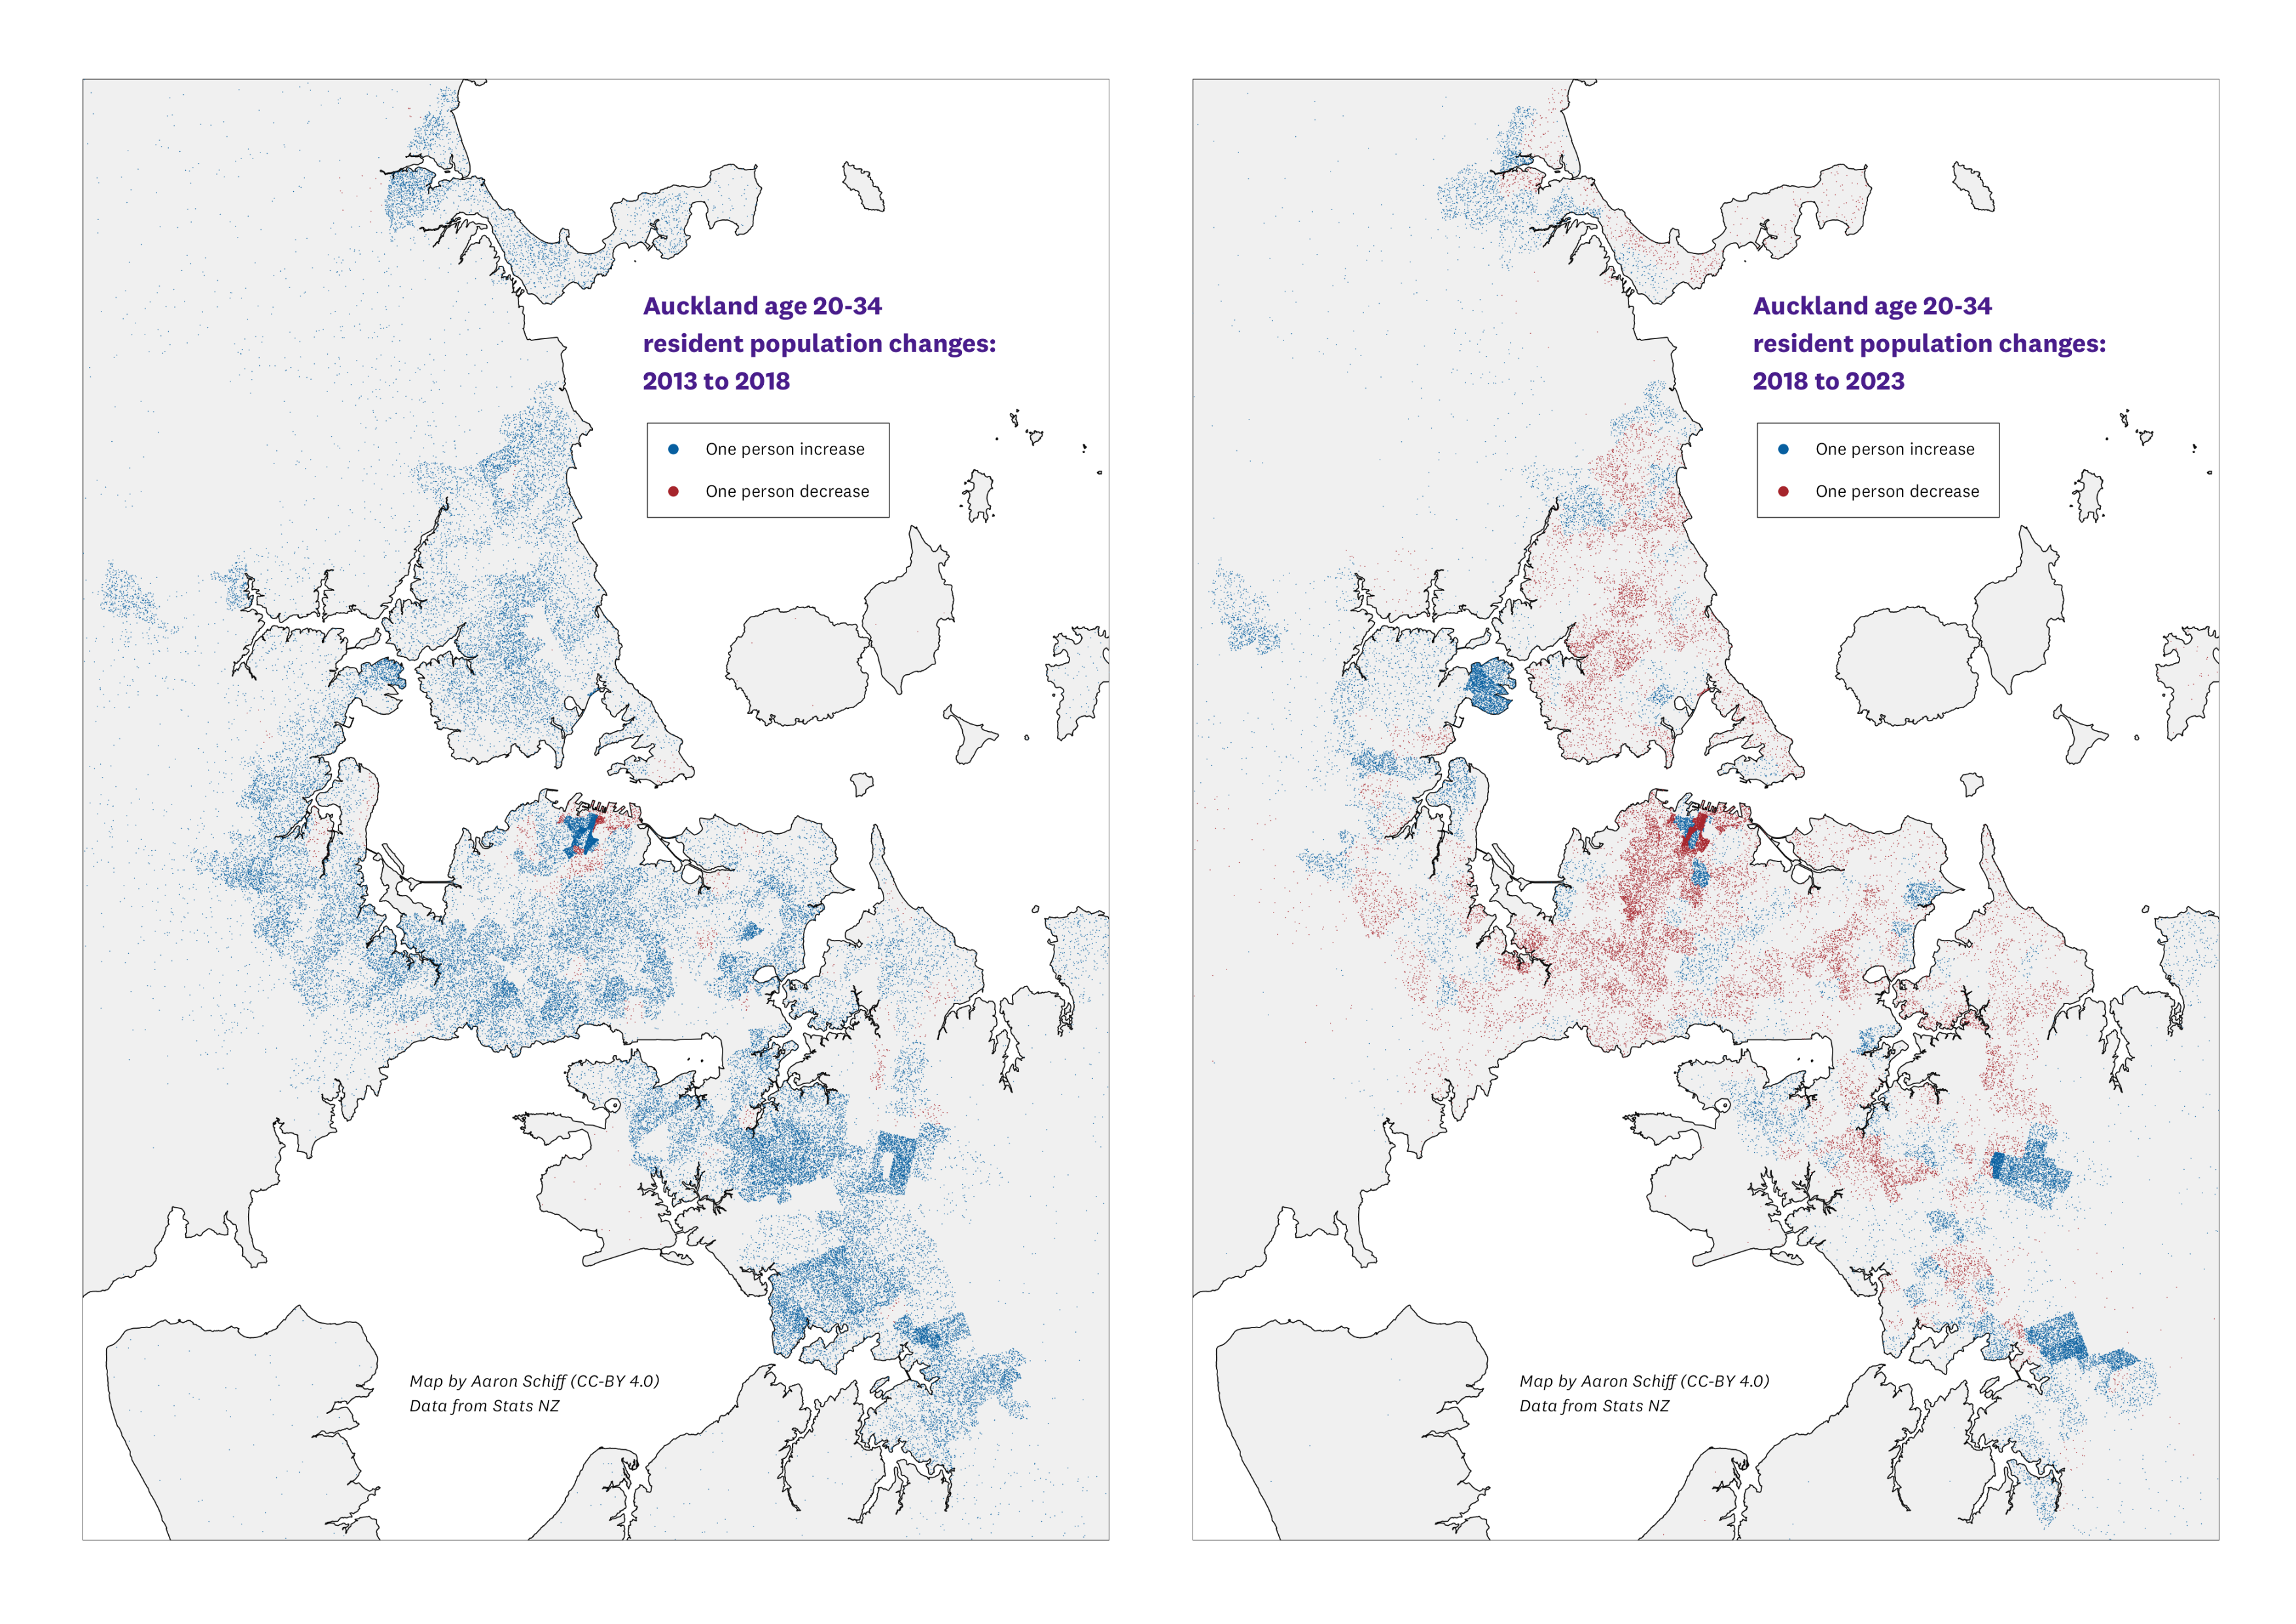
After previous New Zealand Census, I made a dot-density map of changes in the resident population of “youngish adults” in Auckland – people aged 20 to 34 years old.
The reason for focussing on this age group is they are relatively mobile and typically in the stage of life where they are leaving home, entering education or a first job, and maybe starting a family. Housing affordability is a key issue for this group, and it’s interesting to see where they choose to live.
The 2023 Census version is below, showing changes over the 5 years since the previous 2018 Census. Click it to see a bigger version (or check my website). I’ve also included the changes between the 2013 and 2018 Censuses as a comparison.
Dot-density maps are made by calculating the number of people in geographic areas and representing these as one dot per person in each area. I’ve used SA2 areas (similar to suburbs), and the dots are randomly placed in each area (the Census data doesn’t include exactly where people live).
The most striking difference in this comparison is the overall total change in population in this age group. Between the 2013 and 2018 Censuses, Auckland’s resident population aged 20-34 increased by about 69,000 people. Between the 2018 and 2023 Censuses, the population of this age group increased by just 1,200 people in total.
Much of the difference is probably explained by the impact of the pandemic on the international student population. In the 2018 to 2023 map you can see the dark red in the city centre where a lot of students lived. However, the 20-34 year old population decreased in many central areas. The only noticeable increase is in the northwest and southeast, where there was a lot of newer housing built.
See here for a version that compares population changes for this age group across two decades: 2001 to 2011 and 2011 to 2021.

Click to see a bigger version
